-1.png "HR Compliance Consulting Firm")
One of the cardinal principles of Affirmative Action is that a contractor’s workforce should be an accurate representation of the race and gender makeup of the places from where they recruit talent. Under Executive Order 11246, Federal Contractors are required to compare the minority and female makeup of the current workforce in each AAP Job Group to the minority and female makeup of the “available” workforce, to determine if underutilization exists. When underutilization exists, contractors establish a placement goal and develop an action-oriented program to increase representation.
But how should contractors determine who is available? What if talent is sourced from multiple places? How should contractors consider internal candidates? What if jobs require a security clearance or a certain advanced degree? What data sources should contractors use to determine availability statistics? Let’s look at these and other considerations for developing accurate availability settings in your AAP.
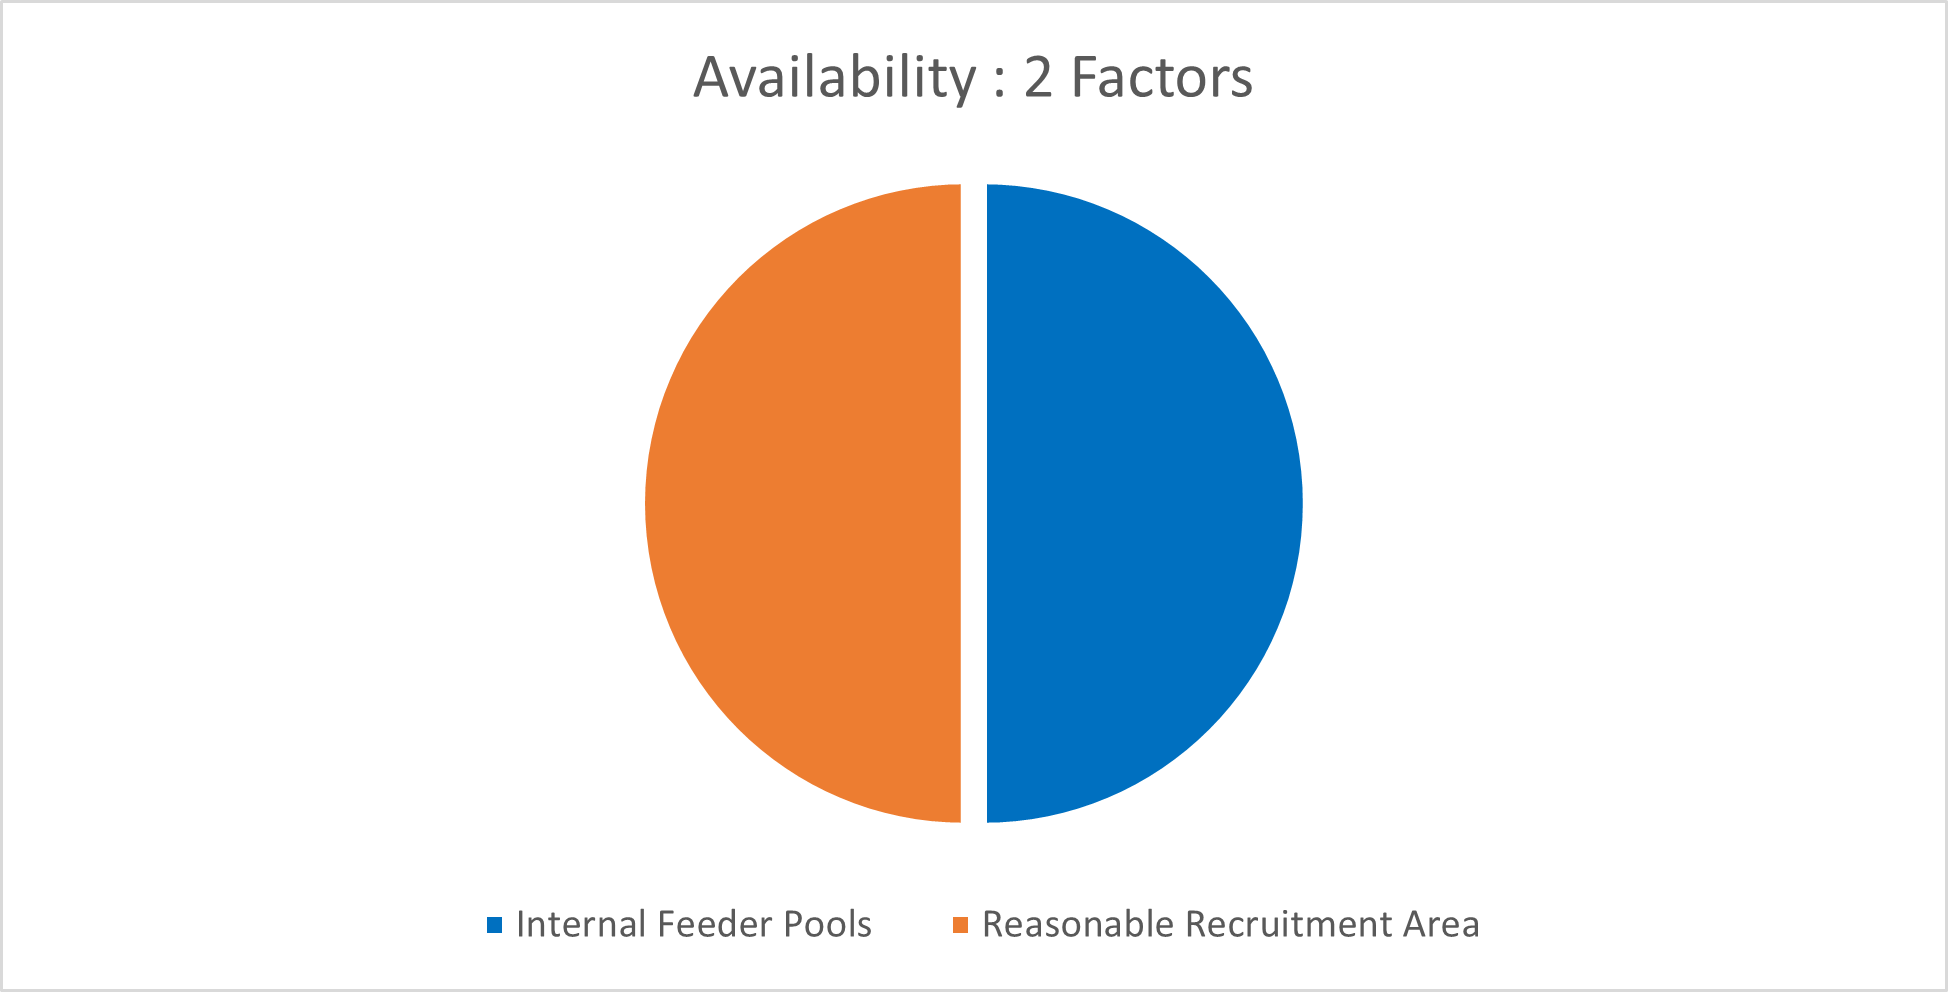
Availability: Two Factors in One
Availability consists of two factors. The first factor is the Reasonable Recruitment Area or RRA: This is the makeup of minorities and women with the requisite skills for jobs in that job group who live in the geographical area where you recruit external talent. The RRA can be as specific as a local town or county, generalized to a metropolitan area, or even as broad as the entirety of the United States, and contractors can combine multiple locations together to create a customized RRA.
The second factor is the makeup of minorities and women in your internal “feeder” workforce who are promotable, trainable, or transferrable to a position in that job group[1]. The internal feeder pool should be comprised of jobs that could reasonably promote through a natural progression, for instance, a Team Lead position in EEO Category 7 that promotes to a Supervisor in EEO 1.2.
Using these 2 Factors split evenly, our Availability Pie looks like this:
[1] Source: Supply &Service Contractors Technical Assistance Guide: https://www.dol.gov/sites/dolgov/files/OFCCP/SupplyService/files/508_sstag_12032020.pdf
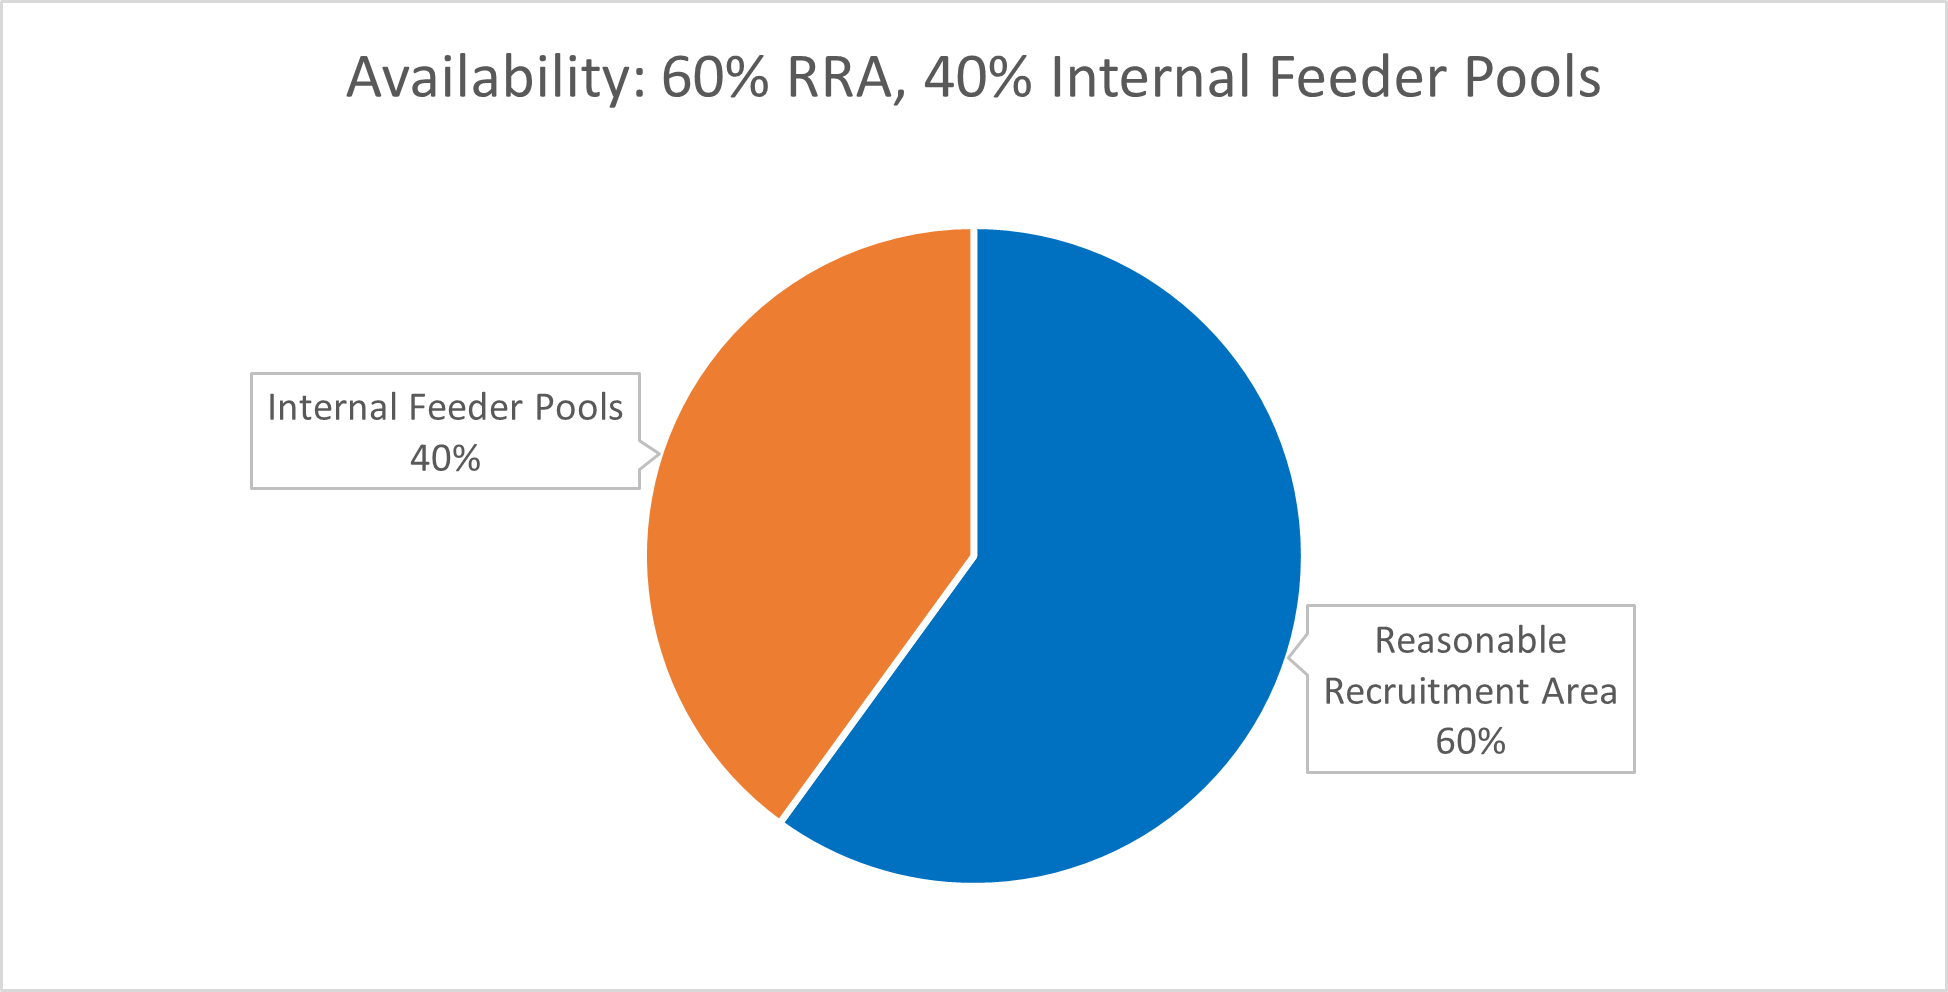
Contractors can choose a weight for these factors, to show the percentage of jobs that are expected to be filled internally vs. externally. Some job groups may have all the weight on the Reasonable Recruitment Area—that is, all open positions in that job group are expected to be filled externally. This is typical of entry-level positions. Conversely, some job groups may have the majority (or all) the weight on the internal Feeder Pools.
Let’s consider a job group of Financial Professionals, where 60% of the jobs are filled externally through the RRA and 40% internally via the Feeder pools. Let’s slice the Availability Pie into 2 factors that are more representative of how this company fills open positions:
Determining the Recruitment Areas for Factor 1
To determine the reasonable recruitment area, let’s start with some basic questions. Where does the company do work? Where do the people currently employed live? Are folks required to come into an office or report to a worksite? If yes, what is a reasonable commuting distance? Can this job be done anywhere? Might the company pay for relocation?
Our job group of Financial Professionals has 25 employees working at a company based in Chicago, Illinois. Most of these jobs are done from the main office; there are 5 positions that require the employees to meet in person with clients in the Racine/Southeast Wisconsin area and 5 positions that can be done from a home office location anywhere in the US. In general, employees live in the Chicago Metro Area, but the remote workers are scattered in Iowa City IA, Tallahassee FL, Syracuse NY, and 2 in Arlington VA.
The Reasonable Recruitment Area could be comprised of the following, based solely on where the current employees live:
|
Chicago Metro |
60.00% |
|
Racine, WI |
20.00% |
|
Arlington, VA |
8.00% |
|
Syracuse, NY |
4.00% |
|
Tallahassee, FL |
4.00% |
|
Iowa City, IA |
4.00% |
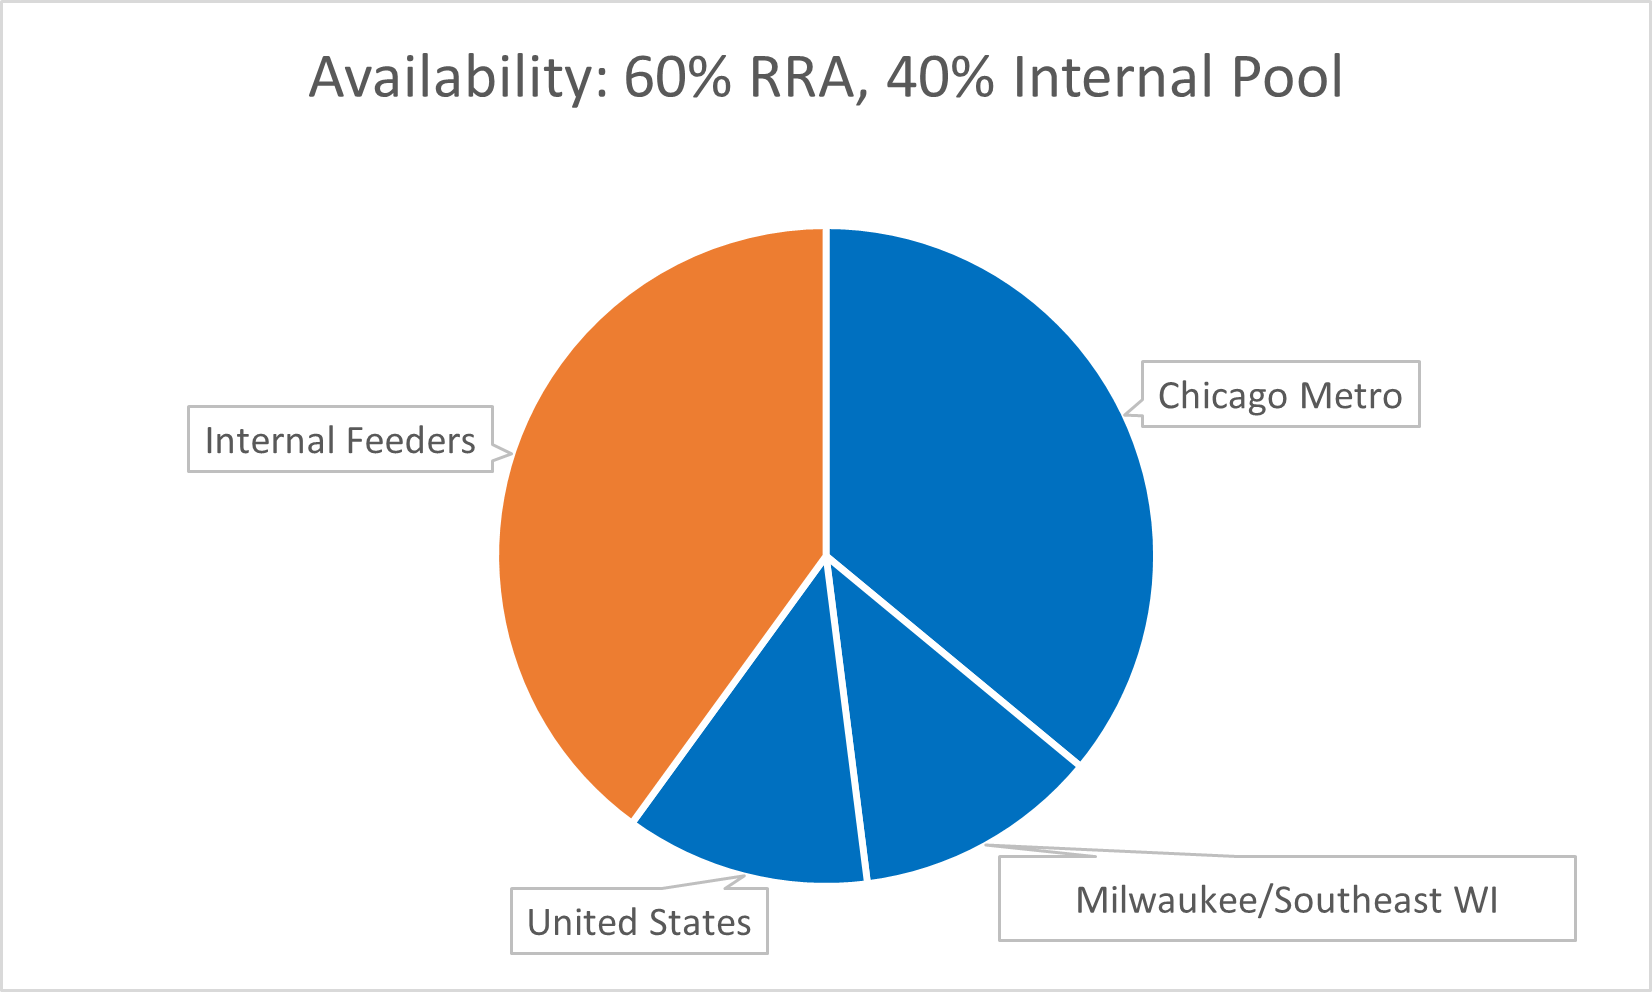
This Recruitment Area is accurate as to where the current employees live, but is it accurate to where open positions would be filled? Remember, 5 of these positions are remote and could be done anywhere. If the Remote workers were to leave the company, recruitment would be nationwide, not just in the areas where current employees live. A broader reasonable recruitment area, like the following, would be more accurate:
|
Chicago Metro |
60.00% |
|
Milwaukee/Southeast WI |
20.00% |
|
United States |
20.00% |
The differences in the two RRAs are an important distinction because the makeup of minorities and women in the United States overall may be very different than the makeup of the individual locations.
Since we’ve determined that the Availability for this job group should be compromised of 60% RRA and 40% Internal Feeders, our Availability Pie now looks like this:
Factor 2: Determining your Feeder Pools
This company said that they expect to fill open positions in this job group with internal candidates 40% of the time. But what makes an internal candidate—is it anyone who works for the company? OFCCP says the Internal Pool should be made up of positions that are promotable, trainable, or transferrable. What jobs typically promote to this job group? Are there clear lines of progression present that could identify feeder jobs? Is there a training program in place where folks come to the company, learn a skill, and progress through levels (for instance an entry-level helper who learns a trade, becomes an apprentice, and then later a journeyman?) Looking at past promotion activity is a good place to start. Also, are there jobs that could promote or be trained for an open position but aren’t reflected in this year’s activity?
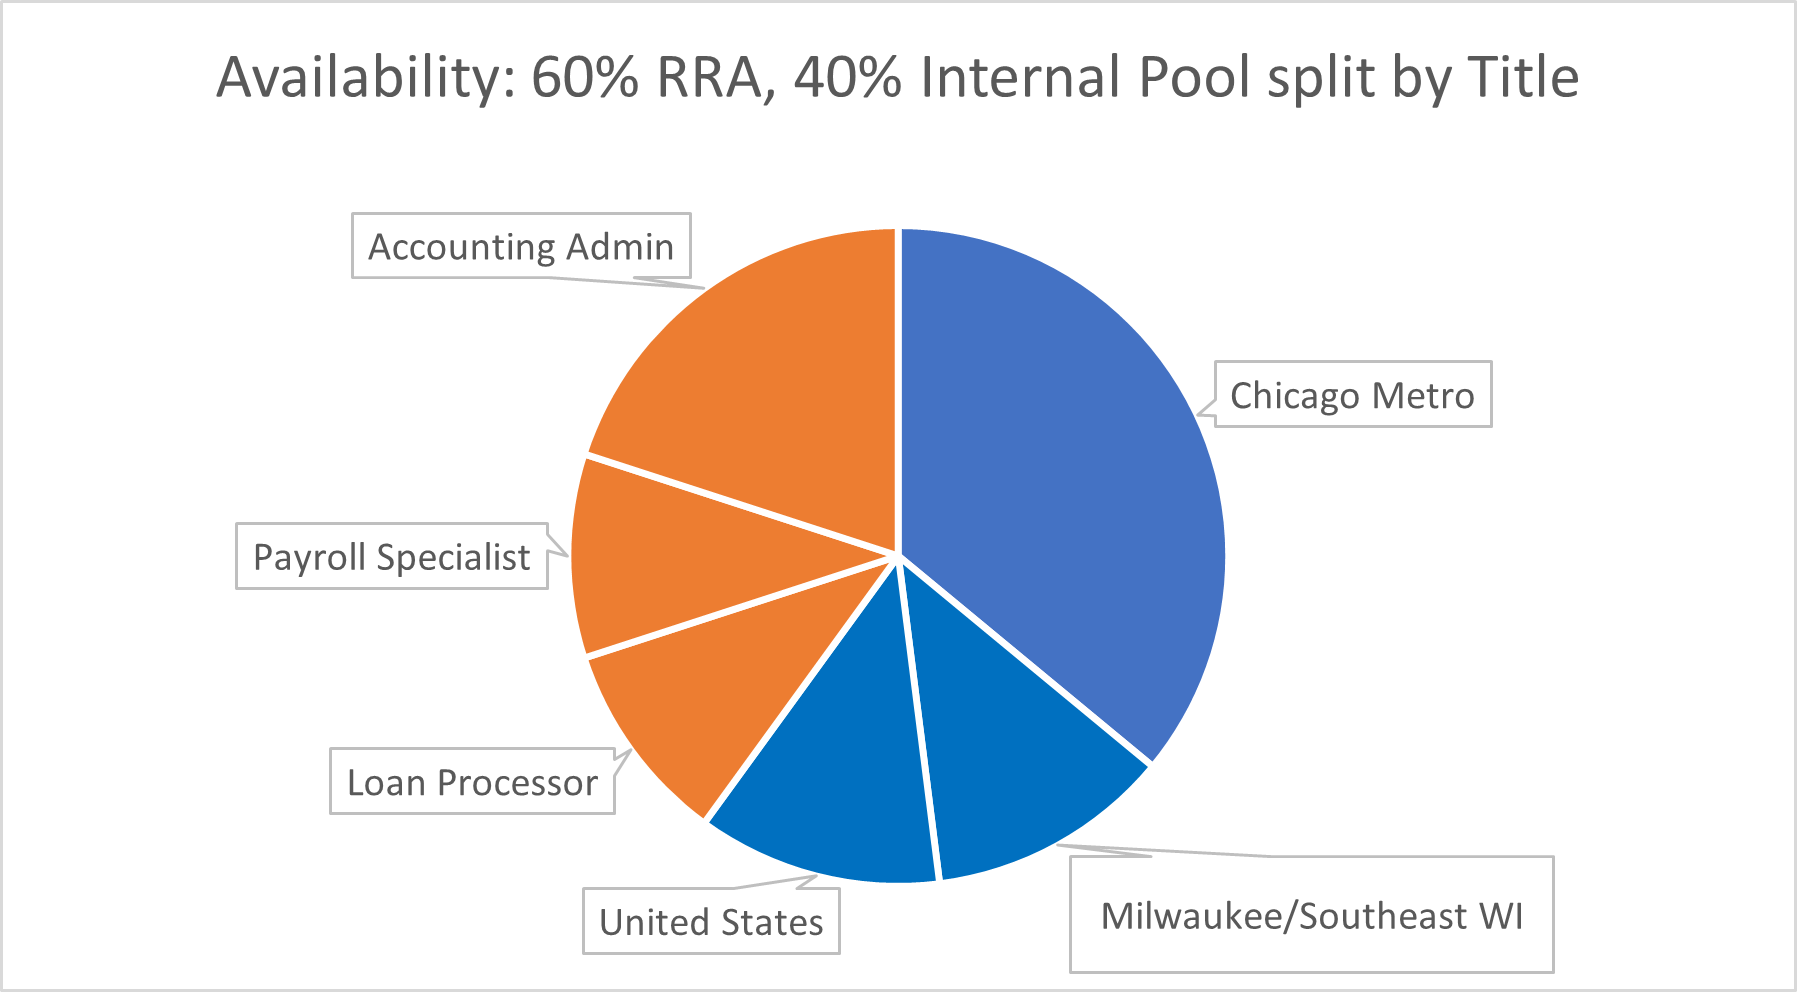
Let’s go back to our Job Group of Financial Professionals. When looking at the prior 12 months of promotion activity, there were 5 promotions into this job group, coming from 3 job titles: Loan Processor, Payroll Specialist, and Receptionist.
When considering past promotion activity, be mindful of outliers. Let’s look at that 1 promotion from a receptionist position. We learned that this promotion was because the Receptionist graduated with a BS in Accounting and was able to move into an open position. Since this promotion isn’t typical of the career path at this company, the company should not include the Receptionist job as part of the Feeder Pool.
This company also has a career path for entry-level Accounting Admins to earn their CPA while working for the company, so they can move up to more specialized positions once they earn that certification. There were no promotions from this job title in the last 12 months, but the company does expect that 50% of their Internal Candidates will come from this position in the future. The company should include the Accounting Admin job as a feeder since promotions from this role are expected to fill positions in the future.
With these considerations, our Internal Feeder pool is made up of 3 positions—Loan Processor, Payroll Specialist, and Accounting Admin. Since the company stated the Accounting Admin job is expected to make up half of the internal candidates, we will carve up the Internal Availability slice to be 25% Loan Processor, 25% Payroll Specialist, and 50% Accounting Admin.
Now that we understand the External Recruitment Area and Internal Feeder Pools, let’s consider how we determine employment availability.
Availability Statistics: What’s in each slice of the pie?
The “Available Workforce” in your Reasonable Recruitment Area isn’t everyone who lives there. Some folks aren’t available—but who? We’re only looking for the people in that RRA that have the requisite skills for the jobs in your job group. To find out who those people are, contractors are required to “use the most current and discrete statistical information available”[1], which is the 2014-2018 Census EEO Tabulation and based on survey data. Your Availability becomes the makeup of minorities and women who indicated that they have a specific occupational skill. What if your job group has more than one census code represented? Then the Availability becomes an aggregate based on how often those census codes appear.
When looking at the job titles in our Job Group of Financial Professionals, we determined there are a few census codes represented: Accountants, Credit Analysts, and Investment Analysts.
First, we determine the Availability % of Minority and Women in each of our Reasonable Recruitment Areas who have the skills for those types of jobs according to the 2014-2018 Census EEO Tabulation[2]:
|
Factor 1: RRA |
Minority |
Women |
|
Chicago Metro (60%) |
20.17 |
54.34 |
|
Milwaukee/Southeast WI (20%) |
||
|
United States (20%) |
Second, we determine the Available % of Minorites and Women in the current workforce, who are in the 3 Feeder jobs we identified.
|
Factor 2 |
Minority |
Women |
|
Feeder jobs |
50.00% |
75.00% |
To combine the Availability numbers for Recruitment Areas and Feeder pools, let’s remember that this company stated they expect to fill open positions 60% of the time via the Reasonable Recruitment Area, and 40% of the time with Internal Feeders. We will take the Raw Availability % and multiply it by the Factor Weight to get the Weighted Statistic.
|
Raw Makeup |
Factor Weight |
Weight Applied |
|||
|
|
Minority |
Women |
Minority |
Women |
|
|
Factor 1: RRA |
20.17% |
54.34% |
60% |
12.10% |
32.60% |
|
Factor 2: Feeder Jobs |
50.00% |
75.00% |
40% |
20.00% |
30.00% |
We add the Weighted Statistics together to determine the Availability for this job group:
|
Minority |
Women |
|
|
Factor 1: RRA |
12.10% |
32.60% |
|
Factor 2 Feeder Jobs: |
20.00% |
30.00% |
|
Availability for this Job Group: |
32.10% |
62.60% |
Over the next year, the company should aim to fill, through either internal or external means, 32.1% of their Financial Professional openings with minorities and 62.6% with women.
Interested in Learning more? For a deeper diver into the mathematical nuances of composite Recruitment Area statistics, check out this blog or view this on-demand webinar. If your company has a specialized need, your Berkshire Consultant can help you generate Recruitment Areas that take citizenship data, degree information, or specific industries into consideration.
[1] Source: 41 CFR 60-2.14(d)
.png?width=593&name=MicrosoftTeams-image%20(4).png "MicrosoftTeams-image (4)")